- The source codes and necessary documentations are available at the repository: (https://github.com/mdtuhinsheikh/introR_ucsas2019).
- The workshop slides are available at the link.
- Prerequisites:
Getting Started
About Me
- Third year Ph.D. Student in Statistics, UConn.
- Research Interests:
- Bayesian biostatistics
- Modelling informative dropout process
- Machine learning and deep learning
- Microbiome data analysis
- Future goals:
- Contribute to the broader field of biostatistics and statistical learning.
Assumption about the audience
- Have little to no experience with R.
- Enthusiastic attitude towards learning R programming.
Aims of the Workshop
- By the end of this workshop, the participants should have a basic understanding of
- What R can do and whether you want to use it in the future
- The ecosystem of R programming
- Data structure and basic R functions
- Import, export, and data management using R
Outline
- R Basics
- File System and Data Structure
- Read and Write Data
- Data Management
- Brief overview of “dplyr” package
What is R?
- R is a free software environment for statistical computing and graphics
- R is a full-featured statistical analysis package (like SAS, SPSS, etc.) that allows to:
- import, export, and manipulate data
- represent data graphically
- analyse and report
- Why the Name “R”?
- Initial of the names of two originators: Ross Ihaka and Robert Gentleman
- More details: https://www.r-project.org.
Why R?
- R is completely free to use and is an open source
- R is compatible with major operating systems (e.g. Windows, macOS, Linux).
- R has a huge library of user-contributed packages with
- frequent release and
- active development
- R is flexible to use
- Popular in academia and industry
- R makes data analysis fun!
Coupling R with RStudio
- RStudio is an integrated development environment for the R programming language.
- Let us introduce with the RStudio interface.
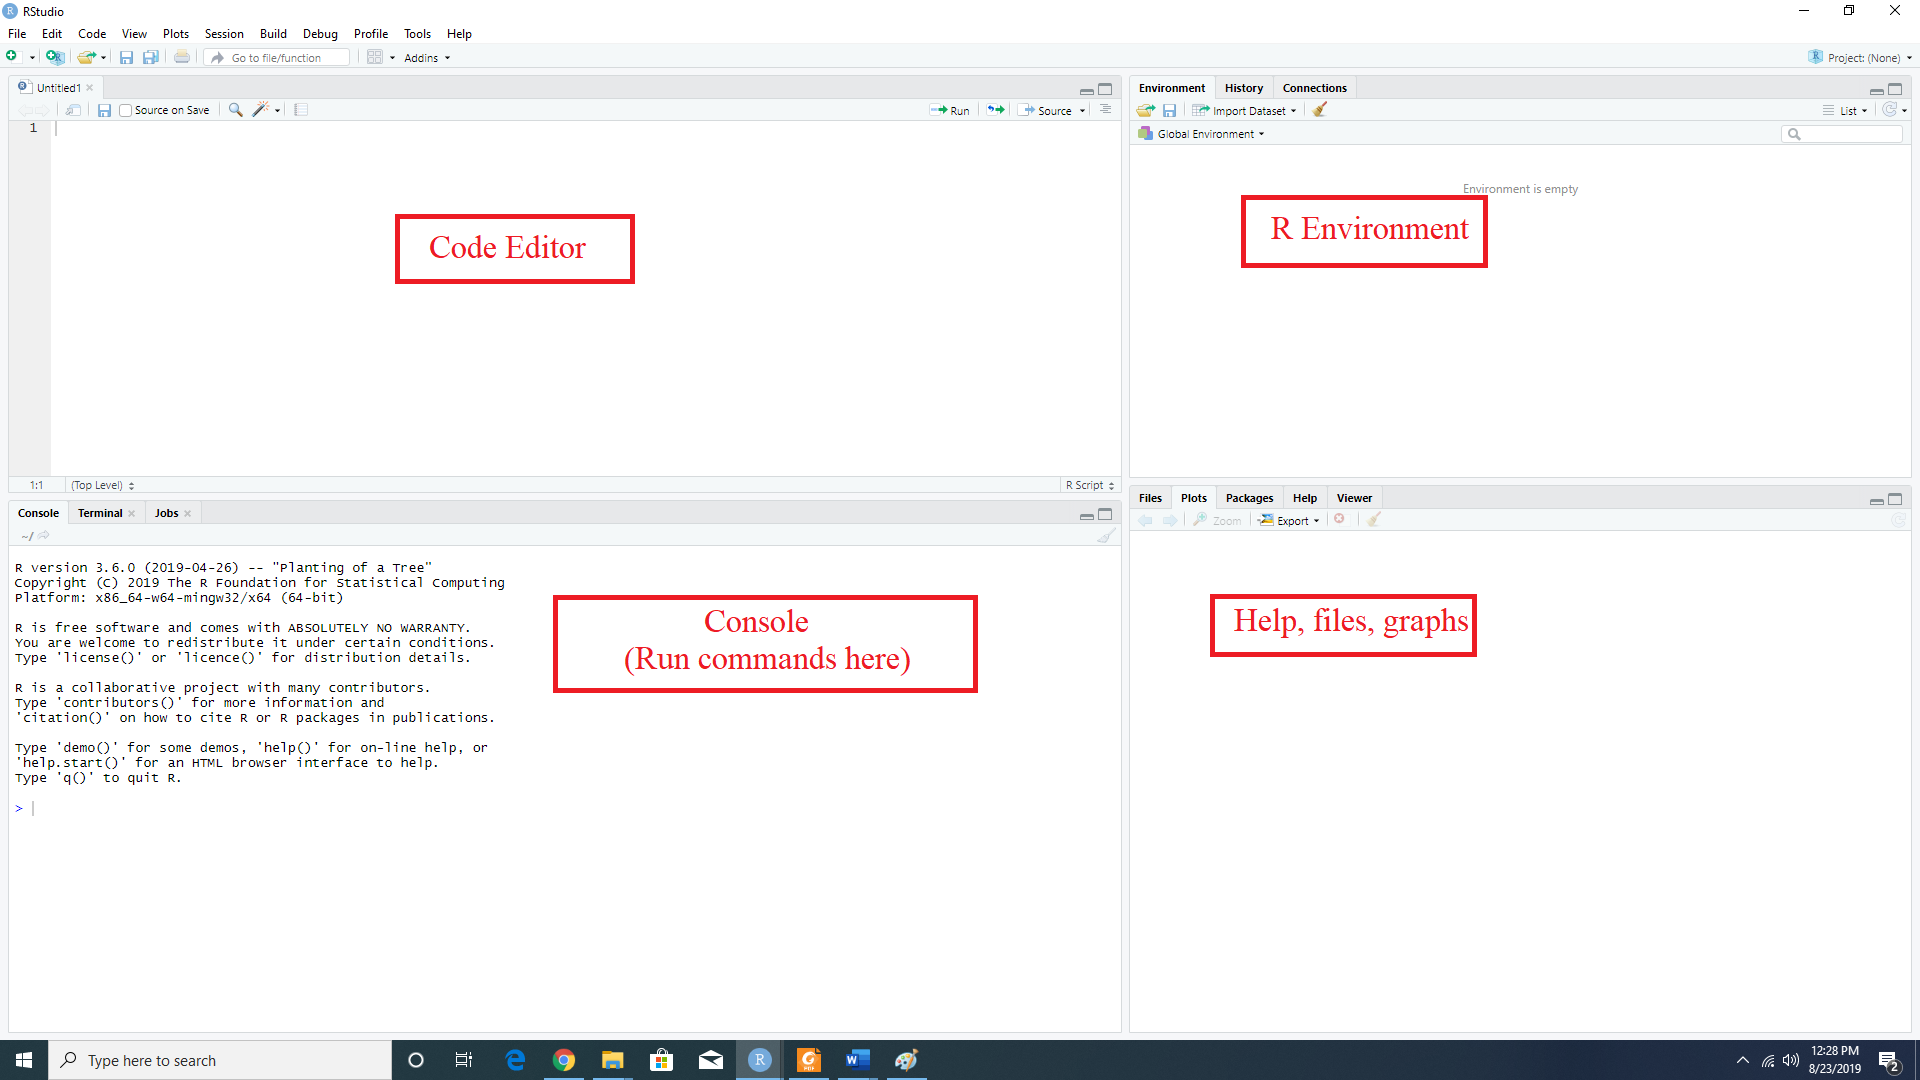
RStudio interface
R as a calculator
5+7                          # 12

exp(5)                       # 148.4132

log(2)                       # 0.6931472
Ask for help?
- If you know the exact name of the function, then try
?function_name, e.g.,
?mean # Search mean function
- If you know specific words then
help.search("text"), e.g.,
help.search("print")
- If you do not know the exact function names, Google search engine or Stack Overflow are always excellent resources.
Assigning operator
- We can assign values to a variable in R by using
<-or=or->. For example,
x <- "Hello World"
x                 # [1] "Hello World"
x = 5
x                 # [1] 5
5 -> x
x                 # [1] 5
Assigning operators cont…
- For combining elements or creating vectors, we can use
c()and[]is used for subsetting and indexing.
x <- c(2, 5, 8)       # [1] 2 5 8
x[2]                  # [1] 5
x[1:2]                # [1] 2 5
x[1]**2               # [1] 4
exp(x)                # [1]    7.389056  148.413159 2980.957987
x[1] %% 2             # [1] 0
x[1] == 2             # [1] TRUE
x[1] < 2              # [1] FALSE
x[1] != 2             # [1] FALSE
Some useful R functions
- For atomic operators:
vector(), length(), names(), setNames(), rep(), rep.int(), rep_len(),
seq(), seq.int(), seq_len(), seq.along(), %in%, match(), rev(), head(),
tail(), paste(), paste0(), typeof(), is.character(), as.character(),
is.numeric(), as.numeric(), is.logical(), as.logical(), ...
- Quiz: Let us try
?repto get to know about this function and then use this function to print {1 2 3 1 2 3} and {1 1 2 2 3 3}.
rep(c(1, 2, 3), times = 2)                 # 1 2 3 1 2 3
rep(c(1, 2, 3), each = 2)                  # 1 1 2 2 3 3
Some useful R functions cont…
- For ordering and subsetting:
sort(), order(), rank(), quantile(),
duplicated(), unique(),
table(), split(), cut().
Some useful functions cont…
- Quiz: Consider we have \(x = (5, 5, 3, 3, 10, 20)\)
- Length of this vector?
- What are the unique values of \(x\)
- Sort the values of \(x\)
- Frequency distribution of \(x\)
Quiz solution
x <- c(3, 3, 5, 5, 10, 20)
length(x)        # 6
unique(x)        # 5 3 10 20
sort(x)          # 3 5 10 20
table(x)         # 3 5 10 20
                 # 2 2  1  1
Basic R data structure
- The common forms of data types are as follows:
| Data Type | Also know as | Example |
|---|---|---|
| Numeric | float | 42, 3.14, -19.2 |
| Character | string or text | “a”, “block1”, “red”, “John” |
| Logical | boolean | TRUE, FALSE |
- Basic R data structures are
- 1d: vector or list
- 2d: matrix or data frame
- nd: array
Basic R data structure cont…
- Vector: a single entity consisting of a collection of numbers or characters.
- The vector index can used by
[].
- The vector index can used by
x <- c(10.4, 5.6, 3.1, 6.4, 21.7)
x[2]          # Second element 5.6
- List: can list vectors or elements with unequal dimension or different data types.
- The indexing for list can be used by
[[]].
- The indexing for list can be used by
x <- list(c(1, 2), c(5, 8, 9))
x[[1]]        # [1] 1 2
x[[2]]        # [1] 5 8 9
Basic R data structure cont…
- Array: multiply subscripted collection of data entries
x <- array(1:12, dim = c(3,2,2))
x[ , , 1] ##      [,1] [,2]
          ## [1,]    1    4
          ## [2,]    2    5
          ## [3,]    3    6
- Matrix: two-dimensional array
x <- matrix(1:6, nrow = 2)
x
##      [,1] [,2] [,3]
## [1,]    1    3    5
## [2,]    2    4    6
Basic R data structure cont…
- Let us learn arithmatic operations of matrix by solving the following quiz
- Quiz: Let \(A = \begin{bmatrix} 1 & 2 \\ 3 & 4 \end{bmatrix}\) and \(B = \begin{bmatrix} 10 & 20 \\ 30 & 40 \end{bmatrix}\).
- What are the dimensions of \(A\) and \(B\)?
- Find the determinant of \(A\) and \(B\).
- Evaluate \(AB\), \(A^{-1}\), and \(B^{-1}\).
Quiz solution
- What are the dimensions of \(A\) and \(B\)?
A <- matrix(c(1, 2, 3, 4), ncol = 2, byrow = TRUE)
B <- matrix(c(10, 20, 30, 40), ncol = 2, byrow = TRUE)

dim(A)
dim(B)
- Find the determinant of \(A\) and \(B\).
det(A)
det(B)
Quiz solution cont…
- Evaluate \(AB\), \(A^{-1}\), and \(B^{-1}\).
A %*% B
solve(A)
solve(B)
Functions
- Basic Structure:
function_name <- function(arguments) {
  # Some operation
}
- Example: function of evaluating absolute value
find_abs <- function(x) {
  if (x > 0) {
    return(x)
  }
  x * -1
}
find_abs(-5)       # 5
Quiz
- Write a function that takes \(x\) and \(y\) as input and evaluates \(x^y\).
Quiz solution
pow <- function(x, y) {
  result <- x^y
  return(result)
}
pow(2, 3)            # 8
Loop and condition
- If we want to repeat a task, we can use for, while, etc. statements.
for(i in 1:5){
  index <- i
  print(index)
}

i=1
while(i <= 5){
  index <- i
  print(index)
  i = i + 1
}
Loop and condition cont…
- Useful arithmatic operators and R syntax
| Operation | Syntax |
|---|---|
| \(x \neq 5\) | x != 5 |
| \(x = 5\) | x == 5 |
| \(x < 5\) | x < 5 |
| \(x \leq 5\) | x <= 5 |
| \(x > 5\) | x > 5 |
| \(x \geq 5\) | x >= 5 |
Loop and condition cont…
- When we want to control how the program should work, we use if statement.
for(i in 1:5){
  if(i != 2){
    index <- i
    print(index)
  }
}
- Loop and conditioning can always be significant component of a R function.
Quiz
- Is matrix multiplication \(AB\) possible? Use the same \(A = \begin{bmatrix} 1 & 2 \\ 3 & 4 \end{bmatrix}\) and \(B = \begin{bmatrix} 10 & 20 \\ 30 & 40 \end{bmatrix}\). Write an R program using if condition.
A <- matrix(c(1, 2, 3, 4), ncol = 2, byrow = TRUE)
B <- matrix(c(10, 20, 30, 40), ncol = 2, byrow = TRUE)

dim(A)
dim(B)

if (dim(A)[2] == dim(B)[1]){
  print("The multiplication is possible")
} else {
  print("The multiplication is not possible")
}
Installing and loading packages
- Basic syntax:
- install a package:
install.packages("package_name")
- load a package:
library("package_name")
- Example: install and load “Lahman” package
install.packages("Lahman")
library(Lahman)
Searching datasets in a package
- Basic syntax:
data(package = "package_name")
- Example:
data(package = "Lahman")
Read and write data from/to local directory
- Read data syntex:
read.table(file = "location_of_file", header = TRUE)
- Write or save data syntex:
write.table(dataName, file = "location_of_file")
- Some of the useful functions for reading and writing data
read.csv(), read.csv2(), write.csv(), write.csv2(), etc.
Read data from a package
- We already know how to search a dataset in a package
- To read a particular data from the package
data("dataName", package = "package_name")
- Quiz: Read “Batting” data from “Lahman” package
Read data from package cont…
data("Batting", package = "Lahman")
# the data will be loaded if no error shows
- To learn about the variables
str("Batting")
#'data.frame':  105861 obs. of  22 variables:
# $ playerID: chr  "abercda01" "addybo01" "allisar01" "allisdo01" ...
# $ yearID  : int  1871 1871 1871 1871 1871 1871 1871 1871 1871 ...
# $ stint   : int  1 1 1 1 1 1 1 1 1 1 ...
# $ teamID  : Factor w/ 149 levels "ALT","ANA","ARI",..: 136 111 39 ...
# $ lgID    : Factor w/ 7 levels "AA","AL","FL",..: 4 4 4 4 4 4 4 4 ...
# $ G       : int  1 25 29 27 25 12 1 31 1 18 ...
# $ AB      : int  4 118 137 133 120 49 4 157 5 86 ...
# $ R       : int  0 30 28 28 29 9 0 66 1 13 ...
# $ H       : int  0 32 40 44 39 11 1 63 1 13 ...
#...
Read data from package cont…
- More detailed description of the variables can be found at the link.
- Using this example we will learn data frame and data management.
- Display few rows of the data
head(Batting)
#   playerID yearID stint teamID lgID  G  AB  R  H X2B X3B HR RBI ...
# 1 abercda01   1871     1    TRO   NA  1   4  0  0   0   0  0   0 ...
# 2  addybo01   1871     1    RC1   NA 25 118 30 32   6   0  0  13 ...
# 3 allisar01   1871     1    CL1   NA 29 137 28 40   4   5  0  19 ...
# 4 allisdo01   1871     1    WS3   NA 27 133 28 44  10   2  2  27 ...
# 5 ansonca01   1871     1    RC1   NA 25 120 29 39  11   3  0  16 ...
# 6 armstbo01   1871     1    FW1   NA 12  49  9 11   2   1  0   5 ...
Basics of dataframe using Batting data
- Indexing works similar to matrix
Batting[, 1:4]
#    playerID yearID stint teamID
# 1 abercda01   1871     1    TRO
# 2  addybo01   1871     1    RC1
# 3 allisar01   1871     1    CL1
# 4 allisdo01   1871     1    WS3
# 5 ansonca01   1871     1    RC1
# 6 armstbo01   1871     1    FW1
# ...
Basics of dataframe using Batting data cont…
- We can also display or work with variable(s) by using $ or mentioning the name of variable inside the indexing.
Batting$playerID
Batting[, c("playerID")]
# Displayes all rows of playerID variable
Batting[1:10, c("playerID", "yearID")]
# Displayes 10 rows of playerID and yearID variables
Basics of dataframe using Batting data cont…
- Create new variable
Batting$CS_SO <- with(Batting, CS + SO)
head(Batting[, c("CS", "SO", "CS_SO")])
#   CS SO CS_SO
# 1  0  0     0
# 2  1  0     1
# 3  1  5     6
# 4  1  2     3
# 5  2  1     3
# 6  1  1     2
Quiz on Batting data
- Display data from 1871 only
- Find the frequency of unique number of players, teams, and year information
- Create a separate dataframe for year 1872 only.
Quiz solution
- Conditioning on the dataframe
Batting[Batting$yearID == "1871", ]   # Displays data from 1871 only
# Displays data for aardsda01 from 1871
Batting[Batting$yearID == "1871" & Batting$playerID == "aardsda01", ]
- Unique number of players, teams, and year information:
length(unique(Batting$playerID))        # [1] 19428
length(unique(Batting$teamID))          # [1] 149
length(unique(Batting$yearID))          # [1] 148
Quiz solution cont…
- Alternative way: using apply() function
apply(Batting, 2, function(x) {length(unique(x))})
# playerID   yearID    stint   teamID ...
#    19428      148        5      149 ...
- Create new dataframe
Batting_1872 <- Batting[Batting$yearID == "1872", ]
Data management using “dplyr” package
- Requirements
install.packages("dplyr")
library(dplyr)
- Let us read “Salary” data from “Lahman” package
data("Salaries", package = "Lahman")
head(Salaries)
#   yearID teamID lgID  playerID salary
# 1   1985    ATL   NL barkele01 870000
# 2   1985    ATL   NL bedrost01 550000
# 3   1985    ATL   NL benedbr01 545000
# 4   1985    ATL   NL  campri01 633333
# 5   1985    ATL   NL ceronri01 625000
# 6   1985    ATL   NL chambch01 800000
Data management using “dplyr” package cont…
- Let us create a subset of “Salary” data without “lgID”
salaries <- Salaries %>%
             select(playerID, yearID, teamID, salary)
head(salaries)
#    playerID yearID teamID salary
# 1 barkele01   1985    ATL 870000
# 2 bedrost01   1985    ATL 550000
# ...
Data management using “dplyr” package cont…
- We want to add salary info of the players in our Batting data
batting <- left_join(Batting, salaries,
                by =c("playerID", "yearID", "teamID"))
- Mean salary
mean(batting$salary, na.rm = TRUE)
Data management using “dplyr” package cont…
- Arrange the data with respect to multiple variables in order
batting <- batting %>% arrange(playerID, yearID, stint)
#   playerID yearID stint teamID lgID  ...  salary
#1 aardsda01   2004     1    SFN   NL  ...  300000
#2 aardsda01   2006     1    CHN   NL  ...   NA
#3 aardsda01   2007     1    CHA   AL  ...  387500
#4 aardsda01   2008     1    BOS   AL  ...  403250
#5 aardsda01   2009     1    SEA   AL  ...  419000
#6 aardsda01   2010     1    SEA   AL  ...  2750000
Quiz
- Filter the data with eiligible players after the year 1899 and with a minimum of 20 base on balls.
- Arrange the eligible players by decreasing order of base on balls.
Quiz solution
- Filter the data with eiligible players after the year 1899 and with a minimum of 20 base on balls
eligibleHitters <- batting %>%
                     filter(yearID >= 1900 & BB > 20)
Quiz solution cont..
- Arrange the eligible players by decreasing order of base on balls.
goodPlayers <- eligibleHitters %>%
                     arrange(desc(BB))
Useful References
- R Programming for Data Science by Roger D. Peng.
- An Introduction to R by W. N. Venables, D. M. Smith and the R Core Team.
- Advanced R by Hadley Wickham.
Thanks
- Good luck with coding R.
- Feel free to contact for further queries: mdtuhin.sheikh@uconn.edu.